Experience the new world of
AI-first supply chain planning.
Join leading global brands who are moving ahead of the market with AI-driven insights that overcome volatility and disruptions.


Your strategic supply chain outcomes delivered.
The Logility® Digital Supply Chain Platform enables you to seize new opportunities, sense and respond to changing market dynamics, and more profitably manage complex global supply chains.
- Integrated Business Planning
- Product
- DemandAI+
- InventoryAI+
- Supply
- Deploy
- Network
- Supply Chain Data Management
Guide your business resources to meet revenue, profitability and customer service goals. Learn more.
Streamline moving product concepts to market, rationalize complex product lines, and drive smart assortment plans and allocation strategies. Learn more.
Improve prediction of true market demand, new product introductions and phase-outs, short life cycle products and promotions. Learn more.
Minimize costs and reduce risk while meeting customer service requirements with multi-echelon inventory optimization (MEIO). Learn more.
Maximize cost-effective throughput and satisfy market demand every day. Learn more.
Position supply to quickly meet demand requirements with smart allocation. Learn more.
Answer complex questions and make decisions faster. Analyze, present, and decide in real time. Learn more.
Gain access to tailored data integration, machine learning and advanced analytics without the headaches of custom development. Learn more.
Empower your supply chain through knowledge.
Planning for the future takes insight. Stay one step ahead.
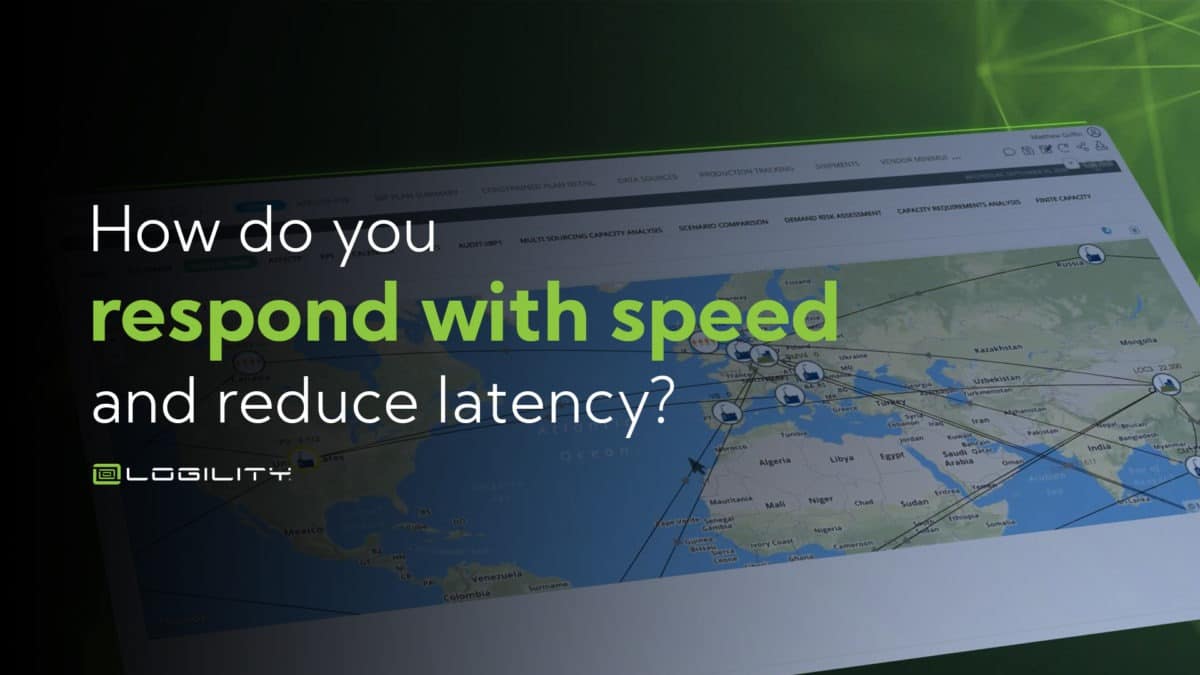
Responding With Speed and Reducing Latency
From Risk to Reward: Mastering Supply Chain Software Implementation for Assured Success